A Chladni plate simulator built on real physics
Sand on a vibrating metal plate gathers into figures. Here’s what a real 24 cm aluminium plate draws from 60 to 1,300 Hz, and the live simulator that drew these pictures.
Free in the Lab. Pick any frequency, square or round, and change the plate’s thickness.
How a Chladni plate works
MeasuredErnst Chladni showed it in 1787: draw a violin bow along the edge of a sand-covered metal plate, and the sand jumps off the parts that shake and settles along the lines that stay still, the nodal lines[1]. Each resonance of the plate has its own figure, and higher frequencies make busier figures with more lines.
From 60 to 1,300 Hz on one plate
All of these are the same plate: aluminium, 24 cm square, 0.75 mm thick, bolted at its centre to a shaker.
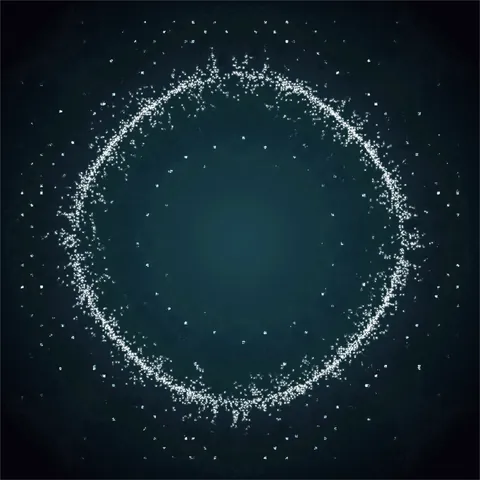
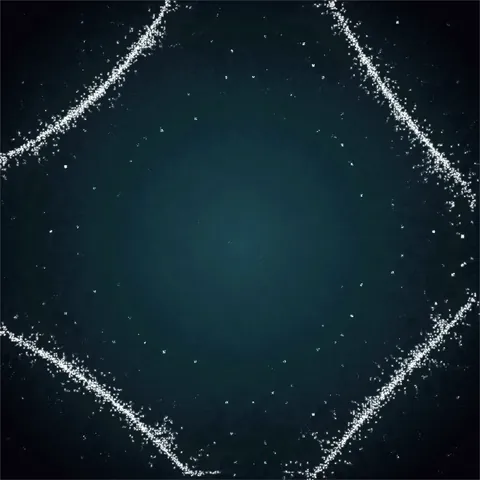
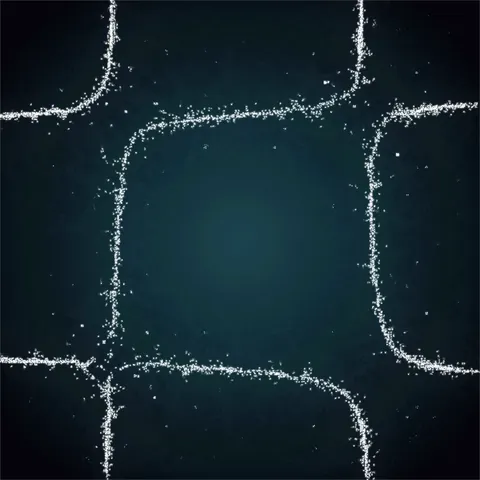
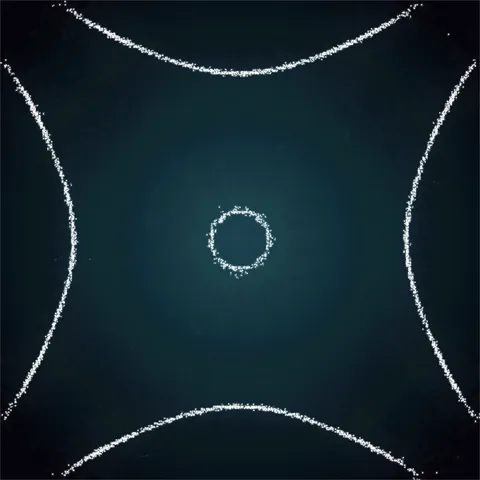
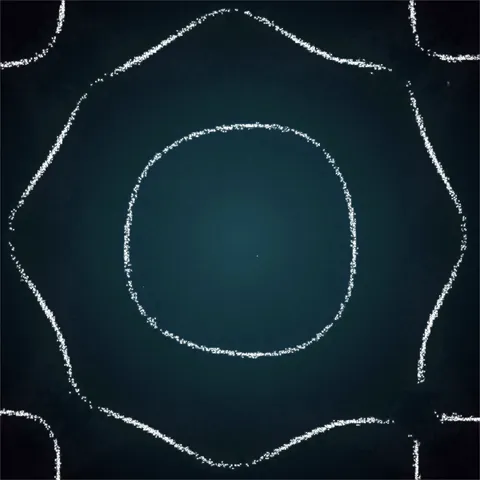
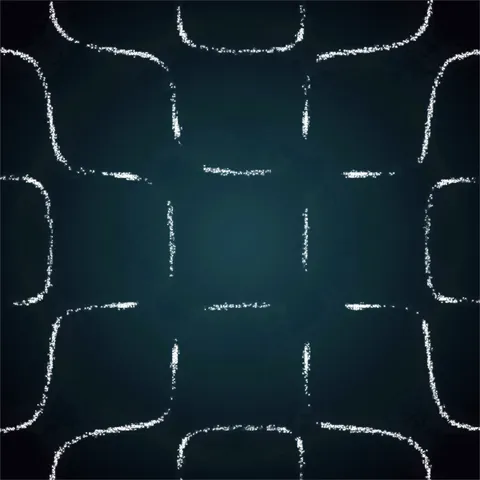
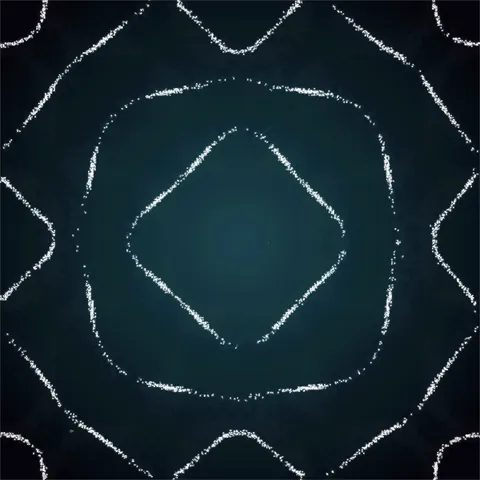
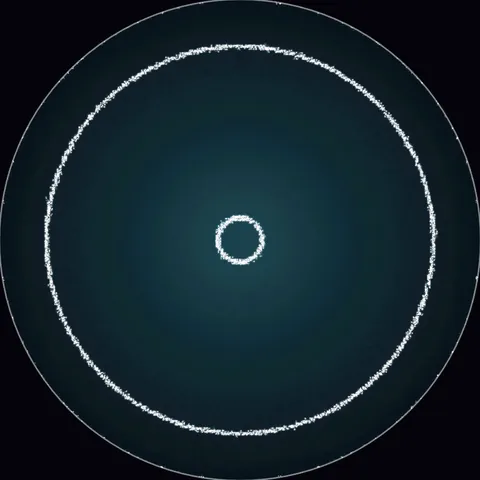
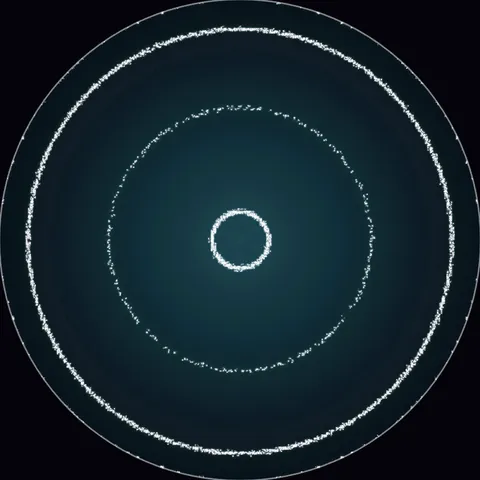
The same plate in a round version, 24 cm across:
Real physics, not a pattern generator
MeasuredMany online cymatics tools draw a textbook formula, or stretch a fixed set of patterns to whatever frequency you type. This one calculates the resonances of an actual plate, the same kind of setup as the UC Santa Cruz physics demo: an aluminium plate bolted at its centre to a vibrator[2]. The calculations match NASA’s standard tables for a free square plate (Leissa, NASA SP-160)[3], and the figures follow the same order as published university lab charts.
One thing it shows that most videos don’t: the same frequency draws different figures on different plates. Make the plate thicker and every resonance moves. Swap the aluminium for steel, glass or ceramic and you get the same figures, in the same order, at slightly different notes. That’s why claims about the “shape” of a frequency, like 432 Hz or 528 Hz, depend entirely on the plate.
Try a real one
A real plate is cheap to set up: a thin metal plate bolted at its centre to a speaker or a mechanical shaker, a tone generator, and fine sand or salt. Coarse grains gather on the still lines. Very fine powder can collect where the plate moves most instead, as Chladni noticed and Michael Faraday studied in 1831[4].
Questions
What is cymatics?
Cymatics is the study of patterns made visible by vibration, like sand on a plate or ripples on water. Chladni plates are the classic example.
Why does the pattern change with frequency?
Each figure belongs to one of the plate’s resonances. Higher resonances bend the plate into more pieces, so the sand draws more lines.
Does the figure depend on the plate?
Completely. Size, thickness, material and how the plate is held all move the resonances. The same tone can draw a cross on one plate and rings on another.
Sources
- Chladni EFF. Entdeckungen über die Theorie des Klanges. Leipzig (1787). Public domain.
- UC Santa Cruz Physics Demonstrations. Chladni figures. ucscphysicsdemo.sites.ucsc.edu
- Leissa AW. Vibration of Plates. NASA SP-160 (1969). ntrs.nasa.gov/citations/19700009156
- Faraday M. On a peculiar class of acoustical figures. Philosophical Transactions of the Royal Society 121:299–340 (1831). doi:10.1098/rstl.1831.0018